
California’s Wildfire Crisis: Risk Modeling and Individualization in Insurer Practices
Wildfire insurance is becoming a front line arena where the distributional politics of climate change are being worked out. As insurers shift risk onto individuals, planners must pay closer attention to the technical tools that make this possible. Developing fluency in wildfire models is essential for critically assessing how risk is calculated, distributed, and justified.
By Mei Mei Collins
For many Californians, navigating the insurance market to obtain affordable coverage is a formidable task. A growing share of homeowners have been forced to purchase expensive wildfire coverage from the FAIR plan (the state’s ‘insurer of last resort’), drop insurance coverage, or move out of their homes altogether. With more than three million Californians living within high wildfire risk areas, these mounting pressures combined with a housing shortage spell trouble – particularly for economically vulnerable residents relying on home ownership as a social safety net. Higher insurance costs have also begun to have a tangible impact on the property market, and potentially pose threats to local government revenue. Underinsured neighborhoods face higher barriers in rebuilding post-wildfires, challenging community cohesion and destabilizing the tax bases of municipalities.
The evolving landscape of insurers’ practices in relation to wildfire risk is an important area of study for planners concerned with climate adaptation. Insurance serves as one of the most salient translators of climate risk to homeowners and has the potential to promote risk mitigation (e.g., home hardening, clearing of fuels in the landscape, or even broader land-use impacts) by producing financial incentives or deterrents. Insurers’ decision-making frameworks and use of wildfire risk tools, as outlined in rate filing documentation, provide an opportunity to consider tensions or alignments that occur between risk modeling and insurance pricing. These relations are crucial for promoting wildfire resilience.
At the same time, insurer practices are relevant to planners considering the distributional effects of climate change. Decisions about how the costs of wildfire risk are spread across policyholders reveal current norms regarding the allocation of emerging costs of climate change. In both these dimensions (climate resilience and the distributional impacts of insurance), a trend toward the individualization of wildfire risks by insurers requires further unpacking. And given insurers’ reliance on wildfire models to interpret and distribute risk, there is a need for planners to develop fluency in the technical dimensions of models to critically assess their application.
Managing Risks with Catastrophe Models
As climate change compounds with continued development in the wildland-urban interface, concentrated catastrophic wildfire events have challenged California’s tightly regulated insurance market. Prior to 2024, the Department of Insurance (CDI) required insurers to rely on the past 20 years of catastrophic event data from their portfolio to calculate a catastrophe load in rate requests. This approach lagged behind the majority of other states in the U.S., which permitted the use of catastrophe models to simulate expected losses for a portfolio in the present-day climate.
Catastrophe Models
Instead of relying only on the record of past events, wildfire catastrophe models employ stochastic methods to simulate probable conditions that would produce wildfires. Through an “event module,” the model generates thousands of fires and simulates their spread with present climate conditions. Combined with information from insurers about the characteristics of buildings in their portfolio and financial terms for insurance policies, the model produces an Annual Average Loss (AAL) value for individual properties and the entire portfolio. This metric, as well as other outputs like an Exceedance Probability curve, makes financial risk legible across insurers, reinsurers, and other financial entities.
Insurers had also been increasingly relying on global reinsurance and other financial instruments to maintain adequate access to capital for tail risks like catastrophic wildfires. Reinsurance distributes risk from one insurer’s portfolio to an array of global entities, which for a cost take on coverage at various loss thresholds. Again, these transactions occurred through the common language of catastrophe models. However, unlike other states, CDI did not permit the inclusion of reinsurance costs in rate requests.
Ultimately, insurers make decisions on underwriting based on the perceived level of risk in their portfolio and the regulated amount of premium they are able to collect. Although they were not allowed to utilize catastrophe models to request higher premiums from CDI, insurers continued to utilize catastrophe models to characterize portfolio risk. These tensions came to a head in 2023, as major insurers such as State Farm dropped policies and restricted new underwriting in California.
In response, by 2024 CDI rolled out the Sustainable Insurance Strategy (SIS) to expand the costs insurers could account for when filing for a new rate. The new policy allows insurers to calculate expected losses for their book of policies based on catastrophe models, and to use that same output to include a standardized cost of reinsurance (Figure 1). Although supported by insurers, the policy was rife with controversy on the part of consumer advocates, who argued that the proprietary nature of catastrophe models precluded public scrutiny and would result in unreasonable rate increases for policyholders. In an effort to address affordability, regulators emphasized the need for catastrophe models to recognize risk mitigation at the local, community, or landscape level.
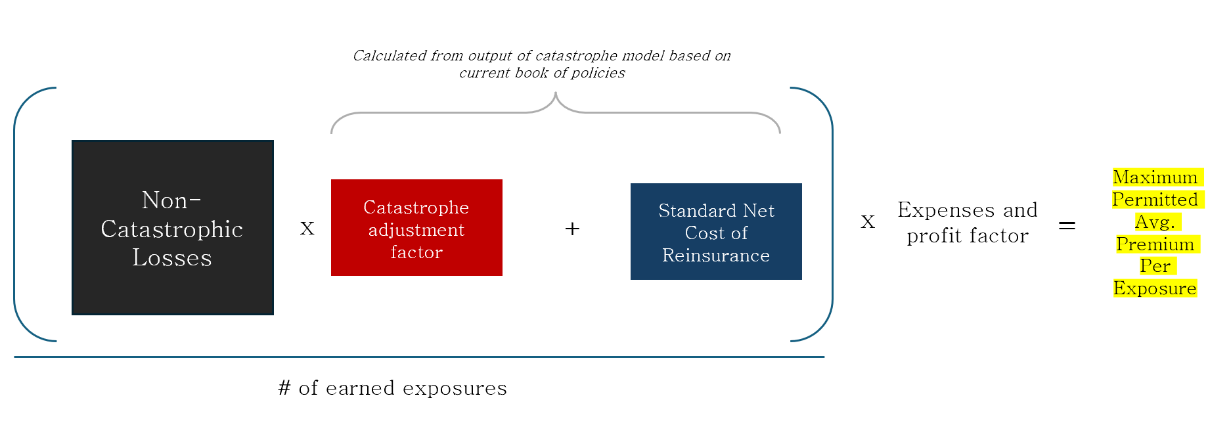
Figure 1: Simplified diagram explaining how CDI permits insurers to calculate a maximum average premium under the SIS. (Source: Author)
Insurer Practices in Determining Premiums
The translation of costs from catastrophe models onto policyholders is much more complex than the new allowance might suggest. Outputs from catastrophe models do not cleanly relate to a home’s premium. In 2025, the FAIR plan reported that the top risk in their book was a policy in Redding, CA, which Verisk’s wildfire catastrophe model calculated to have an AAL of $140,090 (CDI Filing 25-2455). As one might assume, the FAIR plan is not charging that direct cost to the homeowner.
Instead, when filing for a new rate insurers consider how they would like to update base rates and risk relativities for their book of policies. The total increase in premium collected from the book is limited by the maximum value permitted by CDI, as outlined in Figure 1. Often, insurers actually file a rate request that falls under CDI’s maximum permitted increase. Although not formally disclosed, this may be due to desires to avoid costly regulatory proceedings, to slowly phase in costs for policyholders, or to remain cost competitive.
Nevertheless, insurers use different types of models and property-level data to make complex decisions about how premiums should be differentiated (Figure 2). The type of models and their application differ widely across insurers. Some insurers may make underwriting decisions based on simpler hazard scores relating to geographic factors such as fuel, slope, and firefighting access for a property (e.g., Fireline). Others may use predictive models (e.g., ZestyAI’s Z-Fire scores) which determine the risk for properties based on home characteristics and historical wildfires. Others still may utilize the outputs from probabilistic wildfire catastrophe models (e.g., Verisk’s Wildfire model) to establish risk relativities.
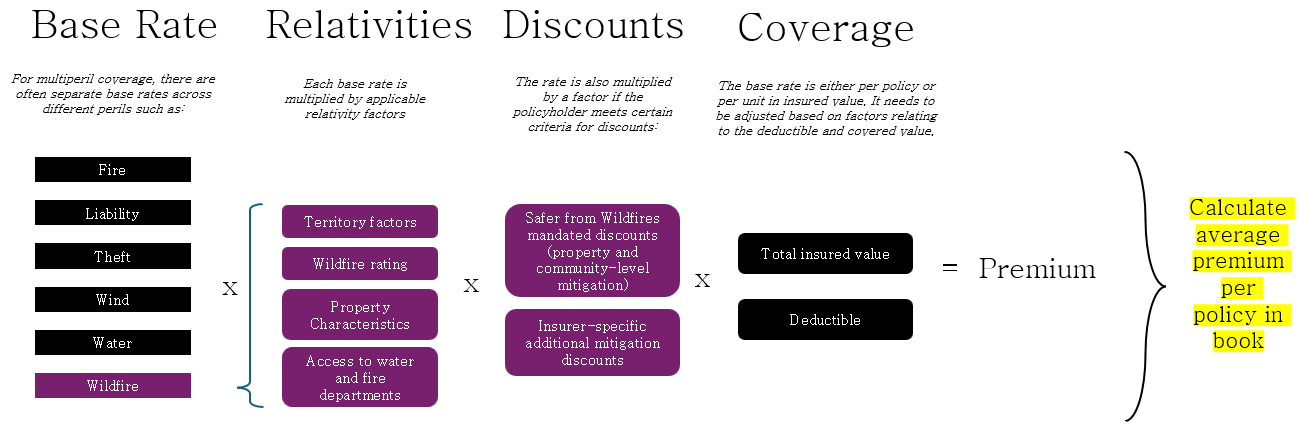
Figure 2: Simplified diagram identifying possible factors involved in the cost of insurance premiums, and how they are summed across the book of policies to calculate an average premium. (Source: Author)
For example, the FAIR plan calculates total catastrophe and reinsurance costs using the Verisk Wildfire Model but uses the ZestyAI Z-Fire Model to establish risk relativities between policies. Insurers also differ in the geographic granularity utilized for risk relativities, and the degree of discounts provided for mitigation actions (Insurance for Good, RFF). Although there has been significant scrutiny of catastrophe models as a method for insurers to request increases in rates, there has been less discussion on the methods used by insurers to set premiums and make decisions about underwriting. However, as the SIS now allows insurers to charge for costs calculated by catastrophe models, risk relativities are in effect distributing expectations of climate change-fueled risk in the system.
Challenges with Wildfire Models
Benchmarking outputs from proprietary wildfire models is notoriously difficult (CarbonPlan, GARP). Modelers boast innovation in using ever-higher resolution data, machine learning methods, and improved algorithms to understand property-level risk. However, differing practices inherently create variance in outputs. For example, catastrophe models may differ in input data, assumptions about near-present climate conditions, treatment of urban conflagration processes, and ignition distributions. Risk models may also differ in chosen classification tiers and risk scoring methods.
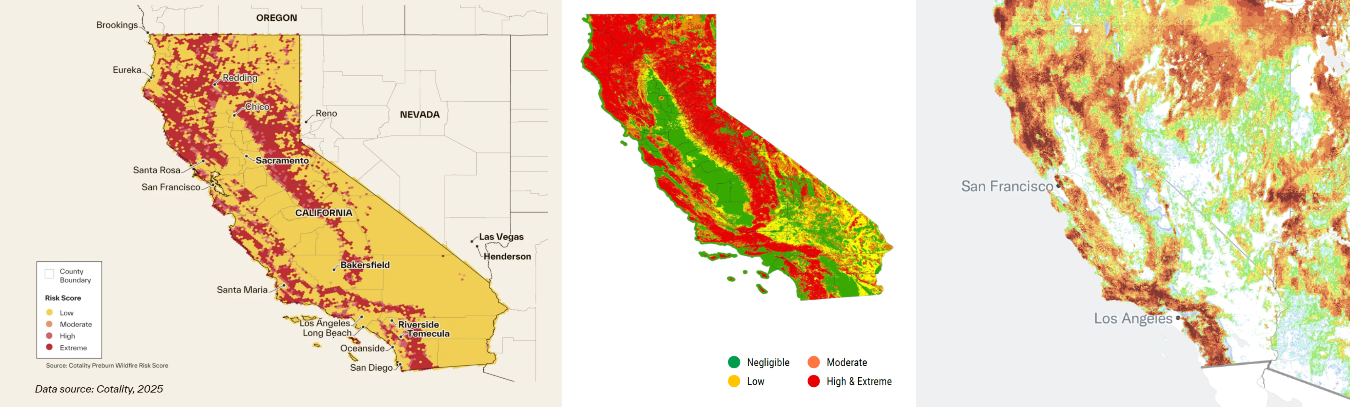
Figure 3 exhibits a simplistic comparison of how classifications of risk from different models vary geographically. Although broad patterns of high wildfire risk align between these tools, the resolution of the data differs and at the local scale, model outputs and classification tiers can differ. For example, the Cotality model on the far left has significantly less granularity in capturing wildfire risk and its classification bins do not capture higher wildfire risk in the eastern portion of southern California.
New research has shown that insurers’ use of different granularities of wildfire risk data could introduce inefficiencies in the market, as prices increase overall from “cream skimming” of less risky properties from insurers with higher fidelity data. The SIS’s requirement that insurers increase underwriting in “distressed” areas elevates this issue as insurers’ territorial risk relativities or perceptions of risk may differ from the territories recognized by CDI.
With limited comparable information between models, it is difficult to determine best practices for how insurers should utilize information from wildfire models. What does this mean when models are employed to make underwriting decisions about individual properties? Are insurers relying on granular hazard information for decision-making simply because their models are capable of producing estimates at that level? Such questions highlight the importance of understanding uncertainties associated with wildfire models as context for their application in insurance. These benchmarking exercises are common in the academic community to compare outputs of Global Climate Models, which by nature also produce varying estimates based on modeling decisions.
Furthermore, the modus operandi of insurers to continuously move toward the individualization of risk in an effort to avoid moral hazards does not necessarily align with the nature of wildfire risk or the state of modeling science. Even the most robust data on an individual property’s building characteristics and mitigation status may mean little when surrounding homes are still highly flammable. Indeed, insurers are grappling with this tension, and community-scale recognition of risk and mitigation actions have emerged. However, the nascency of wildfire modeling for urban conflagrations and impacts of different mitigation actions at the property or community level contribute to challenges in determining best practices for pricing.
Individualization vs. Socialization of Costs
Norms for individualized wildfire risk ratings create an implicit orientation toward the distribution of emerging costs from climate change. There are many arguments for why these costs should not be individualized – for example, decades of governmental policy supporting housing development in the wildland-urban interface, the disconnect between emissions contributions and wildfire risk, and emerging risks that were not at play when homes were purchased. More granular risk classifications in California also shift insurance costs onto lower-income households, since assessed risk is negatively correlated with wealth.
In reality, individualized wildfire risk ratings produce price signals and assign costs, but through the FAIR plan extensive catastrophic risks remain socialized. If the FAIR plan requires additional funds to cover a catastrophic event, the first $500 million will be collected from admitted insurers, and additional costs above that threshold can be levied on policyholders. All insurance plans also include some level of collectivization through the pooling of risk.
Toward New Arrangements of Insurance in the Face of Wildfire Risk
While individualized wildfire risk rating introduces many tensions, an opportunity has also emerged for new arrangements of insurance. For one, positive alignments between wildfire modeling and hazard mitigation have developed at the community level. The Safer from Wildfires Act requires insurers to provide discounts for specific community-level mitigation actions (e.g., membership in a Firewise Community/Fire Risk Reduction Community). In other cases, individual communities have commissioned their own wildfire risk modeling studies to submit as evidence of insurability to attract coverage. By increasing the recognition of community-level mitigation actions in catastrophe and wildfire risk models, incentives can continue to reduce risk in the system and move responsibility for wildfire risk to a collective level. As insurers and regulators continue to navigate coverage in California, there is the opportunity to move toward methods of risk management beyond a reliance on uncertain property-level models and individualized responsibility.
MEI MEI COLLINS is a Master of City Planning student at the University of California, Berkeley, where she focuses on the intersection between climate science and multi-scalar actors affecting community-level resilience. This blog post was drawn from her capstone that explores the use of wildfire catastrophe modeling in California’s insurance landscape, and its role in shaping mitigation and adaptation outcomes.
The author would like to thank Prof. Stephen Collier and Aaditee K. Shankar for their thoughtful feedback on earlier drafts of this piece.